Can you explain why a negative and a negative make a positive? (Part 2)

In my last post, I described an example of using an in-store coupon to explain addition and subtraction using a negative number. Let’s consider multiplications and divisions of negative numbers this time. I think we have many teaching materials showing how, the mechanics of working with negative numbers in math such as flipping signs based on certain rules. Here the goal is to demonstrate why. How would we show a new student why a negative and a negative make a positive? What real life situations can we use to describe ( – 200 ) x ( – 7 ) = +1400?

For this, I want to use a cell phone data story. I subscribe to a family data plan. To avoid excessive use of data, I turned off “Data” in all of our phone settings so we only use the internet at home via WiFi. However, one day, I noticed that we are still losing data faster than I expected. I’ve looked into the usage log and found that at around 2 am the night before, about 200 MB data was consumed. Apple phones have a setting called “WiFi Assist” which uses the cellular data to accelerate the internet speed when WiFi is slow. I did not know this and thus had not turn it off. Our phones have been using the cellular data to update their apps at night.

I lost (-) 200 MB data one night. Let’s say I wanted to forecast how much data I will lose in 7 days if I didn’t turn off “WiFi Assist”. I am losing (-) 200 MB a day. Advancing forward (+) 7 more days, I will lose (-) 1400 MB, or ( -200 MB ) x ( +7 days ) = ( -1400 ). See that a negative number multiplied by a positive number results in a negative number. 

Now let’s say I wanted to know how much data I had had before “WiFi Assist” consumed it. My monthly plan refreshed just 7 days ago. If about the same amount of data was consumed every day, I need to backtrack (-) 7 days to figure out how much in total I had. So ( -200 MB per day ) x ( -7 days ) gives me +1400 MB of data I had. A negative number multiplied by another negative number resulted in a positive number.

Now try a division this time. My goal is to figure out how many days I have been losing data because of this “WiFi Assist.” Assume I already know that I used to have (+) 1400 MB of data in total. I also know that I lost (-) 200 MB last night. Assuming that the same amount is being consumed every day, I would calculate: ( +1400 MB ) ÷ ( -200 MB per day) = ( -7 days). Or it was 7 days ago that I had full 1400 MB of data. See that a positive divided by a negative results in a negative number.

Now let’s forecast how many more days it will take to lose (-) 1000 MB more if I continue to have “WiFi Assist” turned on. I would calculate it as follows: ( -1000 MB ) ÷ ( -200 MB per day ) = ( +5 days ). 5 more days need to advance forward before I lose (-) 1000 MB more. Note this time that a negative number divided by another negative results in a positive number.

Working with negative numbers increases the awareness of your starting position whereas such awareness may not have existed before. Knowing where you are now is an essential piece of information to solving many problems. That’s the Theory of Negativity introduced by A. Neinstein. (ha, ha, ha)

I hope this example is helpful. You may also have good examples to share. If you do, please share it in the comment section.

Can you explain why a negative and a negative make a positive? (Part 1)

It’s September and kids are going back to school. They meet new friends, new teachers, and challenges of learning new concepts. As a parent, I often get questions from my kids. But they ask questions that stump us sometimes.

For example, how do you explain when you subtract a negative number, you get a number bigger than you started? 1 – ( – 5 ) = 6 as an example. Mechanically I understand how to compute it. But how do I explain this to a child who is trying to understand why?

Stumped? It stumped me. I thought about using a timeline to show an example. Also I thought about using temperature as an example. None really worked until I finally came up with one that worked. Here’s how I explained it.

At a grocery store, you see an in-store coupon for a box of ice cream. The regular price is $9.99 but with the coupon, you get $2 off, or -$2 from the regular price. When you ADD (+) the coupon, the resulting price is lower than you started: $9.99 +  (-$2.00) = $7.99. At the cash register, you realize you lost the coupon. You thought you would only pay $7.99. But now you TAKE AWAY (-) the coupon, you will pay $2.00 more: $7.99 – (-$2.00) = $9.99.

I hope this example is helpful. You may also have good examples to share. If you do, please share it in the comment section. In my next post, I will explain how to give examples of negative multiplications and divisions.

Opportunity to add 4 million jobs

In my last post, I talked about how the shortage of mortgage is the major reason for sluggish housing market. In fact, even the Fed Chairman Ben Bernanke has said “the pendulum has swung too far the other way” in his recent speeches referring to tight lending practices.

Based on my analysis, all other key indicators point to much faster growth potential for the housing market today. Without the mortgage drag, we would have seen around 1.3 million single-family housing starts in 2012. Instead, only a bit over 400,000 single-family housing projects started in 2011 and we are seeing some improvement over that in the past year. (National Association of Home Builders says “the long-run trend of 1.7 to 1.8 million new homes” are necessary to accommodate population growth and replacement of older housing stock.)

The single-family housing constructions not only mirrors the volume of housing transactions, but also is considered a very important driver of our economy. National Association of Home Builders claims 3 job creations for every new house constructed. That’s 4 million additional jobs a year if the mortgage pendulum swings back to the center. Solving today’s mortgage issue is the key to unlock economic growth.

So the key question is this. Why aren’t banks lending money especially to home buyers? Here are some of what’s going on in the mortgage industry today.

“Put-back” – Freddie Mac and Fannie Mae were instrumental in blowing the last housing bubble. But they themselves do not lend money. They buy loans from banks and other financial institutions to offer to the home buyers. When the borrower defaults and those banks are deemed to be at fault, Freddie and Fannie can force the banks to buy back those loans. This is called “put-backs”. When they buy back those loans, banks need realize loss on their books. So far there has been about $66 billion put-backs of loans made between 2006 and 2008. There are still a substantial amount of mortgage loans outstanding that have been made during the bubble years. Banks are extremely becoming conservative in qualifying loans today to avoid put-backs in future.

FHA in trouble – The Federal Housing Administration insures more than $1.3 trillion mortgages in the U.S. Last month, the media reported that the Federal Housing Administration has negative $13.48 billion in its mortgage insurance fund. This is an estimate of the difference between insurance premium the F.H.A collects on its mortgage insurance and the claims it has to pay in the future. This is a big uncertainty. If foreclosures continue because of bad lending practices during the housing bubble, the F.H.A.’s insurance money can dry up. That means the originators of those loans – i.e. banks – will suffer.

So banks are scared to death and they are tightening the belt beyond what is considered reasonable during normal times. Ben Bernanke is pumping money into the market by buying back mortgage backed securities to try and maintain the low interest rate to stimulate home buying in this country. But to his own admission, there’s limit to what the Fed can do. They cannot force banks to lend money even if the money is abundant.

Overly lax lending standard got us into this mess in the first place. And we still don’t have it right. These stories above are a clear indication that banks don’t feel confident about their ability to measure and take the risk of lending. This represents a very interesting opportunity.

There is a big pent-up demand for housing today as all other indicators of the housing market show. If someone has billions in capital and ability to take calculated risk more than today’s conventional lenders, that someone can reap big rewards.

Let’s see who is pouring money into the housing market these days. Hedge funds.  They participate in today’s housing market by buying up lots of foreclosed houses around the country. While they rent those houses to get returns now, often to the same residents who can no longer afford to pay the mortgages, and they will get more returns by selling them when the market picks up again. Who else? Foreign investors are increasingly investing in the U.S. housing. People with cash – those who don’t need to go to the banks are buying houses in the U.S. today.

Housing – What’s keeping it low?

Tuning to National Public Radio the other day, I stumbled across a discussion where a person being interviewed was making remarks about the current state of the U.S. housing market and how important it is to the economy. He said the housing market is where the economic collapse started, so wouldn’t it also be true that it drives recovery? That’s an intriguing question. A house is probably not only the most expensive item to own for many people, it also drives other expenditures like energy, utilities, services, furniture and appliances, etc. Housing activities drive cascading demands which benefit many businesses. So I got curious. What’s keeping the housing market from growing faster?

For those of you who don’t have time to read through the rest, I will give you my observation in a nutshell: It seems that the housing market is not recovering quickly because the banks are not lending enough money to the home buyers. I am not talking about a “course correction” kind of loan reduction. It’s really really low. And forget about the mortgage rates that are record low today. They are not stimulating the growth of our economy as they should. It’s the mortgage volume for purchasing homes that really matters.

For those of you who are interested, I will explain what I found more in detail.

To understand housing market, I decided to pay particular attention to the single-family housing starts. It’s a number that the Census Bureau tracks to measure the number of constructions designed for housing a single-family as opposed to multi-family. I learned that the single-family housing starts is a good indicator for the housing market as it historically mirrors the demand for homes. Also the single-family housing starts is often considered a leading indicator for the economy. If I could build a predictive model where I can point my finger at what really drives the housing starts, then I should have a better sense of which actions are more preferable to drive the economy, right? So that’s what I tried.
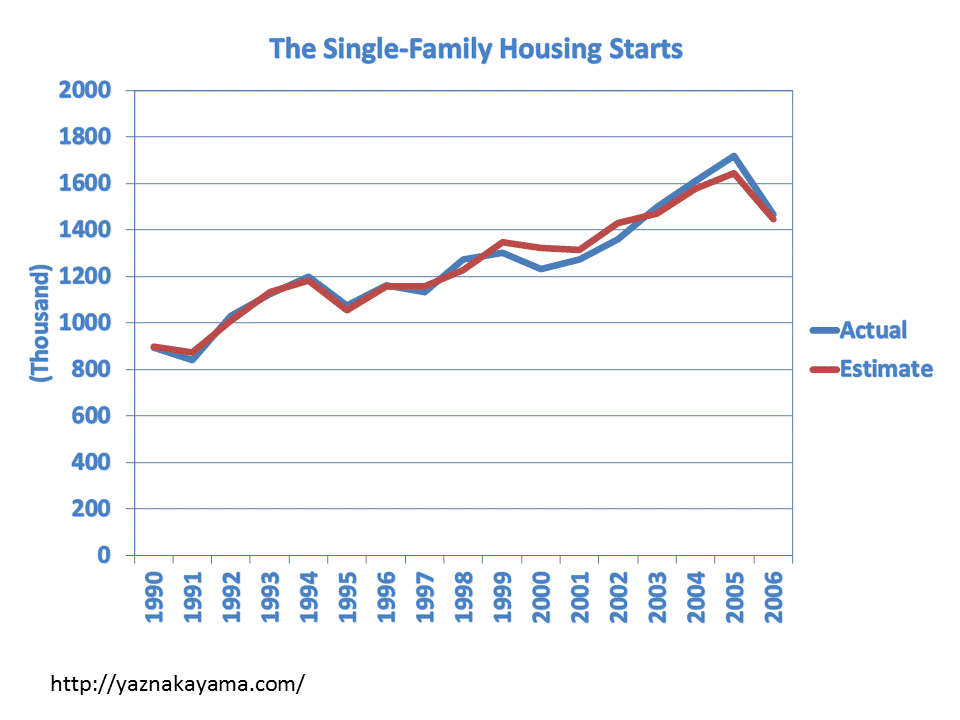
This chart shows both the actual and the estimate of the single-family housing starts based on a simulation model built from a multivariate regression analysis. Multivariate regression is a useful tool to see relationships between various sets of data. For example, you have an idea that people’s weight, the amount of daily exercise and daily sugar consumptions may be all related. Comparing 3 sets of data, the multivariate regression will show us mathematical relationships between them. We can use that math to estimate the weight of a person by plugging in the amount of his daily exercise and daily sugar consumption.

The approach I took to create the housing starts forecasting model was “predicting the past”. Since we already know what happened to the single-family housing starts in our recent history, we can use the knowledge to test the quality of “predictions”. In this case, I took various data from 1990 to 1999 to build a math equation for estimating the single-family housing starts. Then, I used the same equation and plugged in inputs from 2000 and beyond to see if I could accurately forecast the single-family housing starts for the same period. To build this model, I set myself a goal of making predictions within + or -10% of the actual or better for at least 5 years of making predictions. I came to a point where the model became good enough. Between 2000 and 2006, the biggest error happened in the year 2000 when the estimate was off by about 7%.

So what were the drivers? Initially I took a range of data inputs that I suspected would impact the growth of home building activities, like GDP, population, consumer sentiment, interest rates, housing prices, unemployment, etc. With some trial-and-error, I pruned some, added some and made a mix of inputs to give accurate enough estimates. As it turns out, what really mattered to forecast the outcome accurately were long-term interest rates, population, building cost index (inflation adjusted), mortgage originations for home purchase (inflation adjusted), and vacancy rates for homeowner units: 1 unit. There were also inputs I had expected to be important but weren’t. They include unemployment, housing prices, consumer sentiment index and, to some extent, interest rates. (You could actually make almost as accurate forecasts without the long-term interest rates.)

You may be wondering what happened after 2006 as my forecast ended there in the chart above. Well, this is what happened.
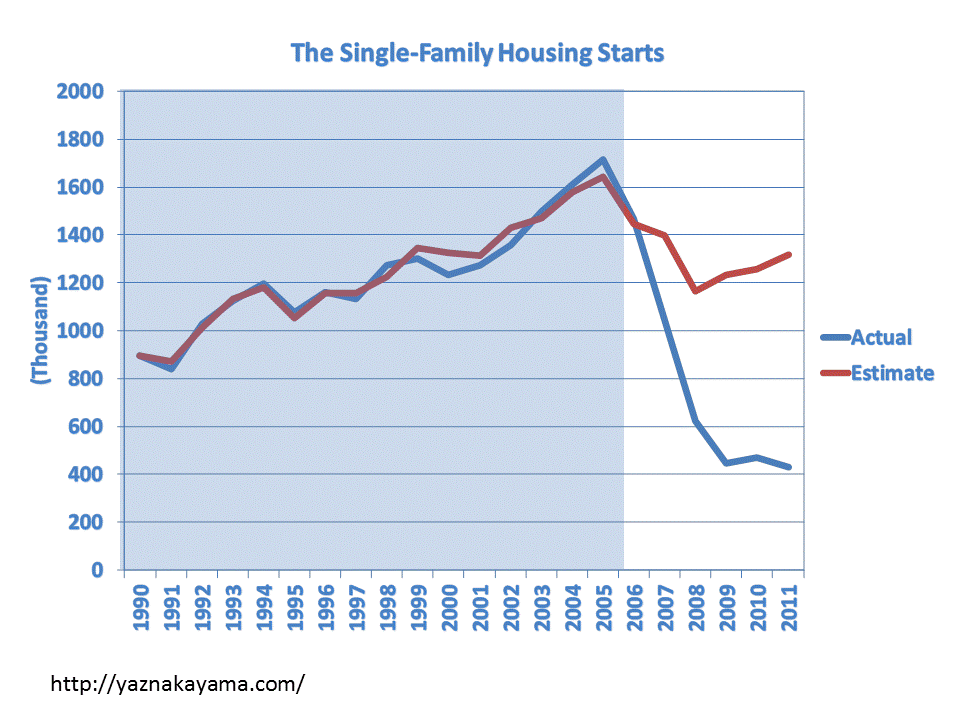

Holly crap! The model stopped working. The red line tells me that we should be having more housing constructions if we were still living in the same world that we lived up until 2006. Based on this model, we are not living it today.

It took me a while to figure this out, but in the new world, I discovered that you don’t need much data input to forecast the housing starts. All I needed was 2 inputs: mortgage originations for home purchase and vacancy rates for homeowner units: 1 unit.
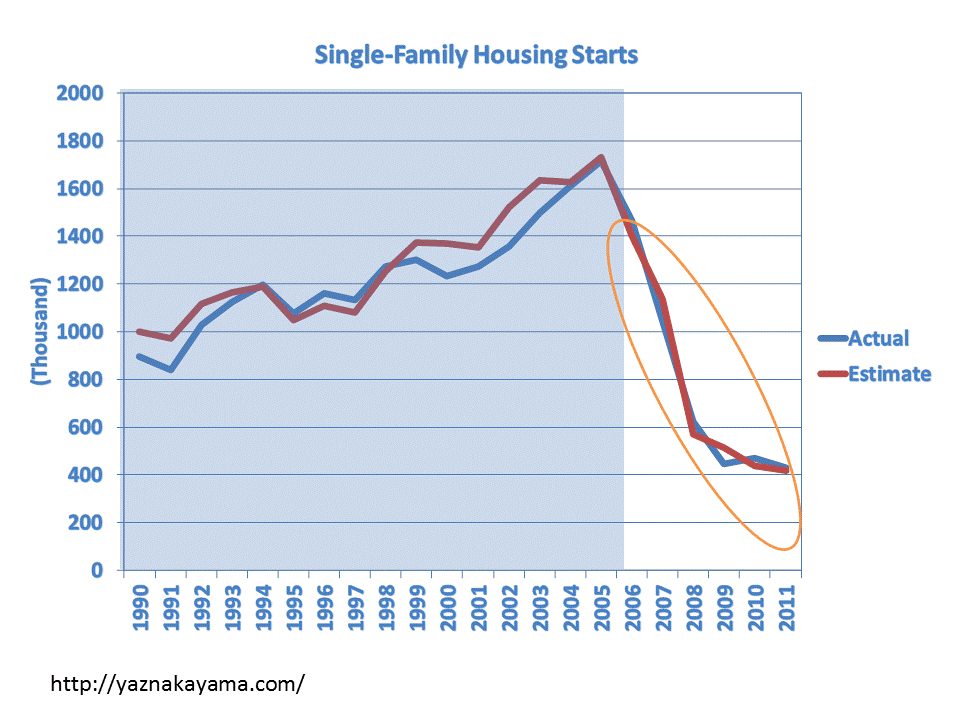
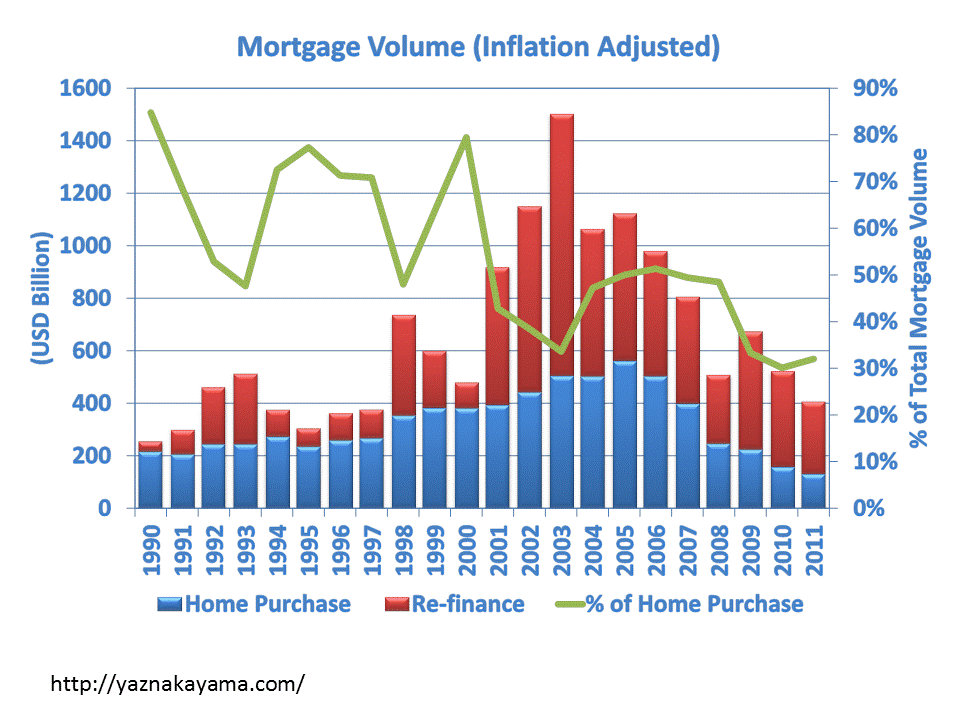
Between the two inputs, the mortgage origination by far has a bigger influence in the housing starts today. The impact of population growth or that of low interest rates are so negligible they no longer link to the changes of the housing starts because the home buyers don’t have enough money to buy houses. Today the volume of mortgage origination to the home buyers is so small. Adjusted for inflation, the mortgage provided to the home buyers in 2011 was only about 60% of what was lent to the home buyers in 1991. If I remember correctly, we saw a housing market crisis in 1991. To make an analogy, it’s like driving a car with the parking brake on. No matter how great your engine or suspension is, it just doesn’t accelerate.

So where is the mortgage money going? It’s going to re-finance existing loans.
So what are actions that will boost the economy going forward? Any actions to stimulate lending for home buyers will definitely help. I have 2 suggestions.

Number one, the banks need to make money. Banks’ current lending practices may be overly cautious. It is true that the Basel III and Tier 1 Capital Ratio requirements are making the banking executives more conservative. However, improved profitability for banks will give added cushion and allows banks to become less constricted in lending more money. I am not advocating for crazy lending and securitization practices that got us into this mess. However, the pendulum seems to have swung a bit too much in the other direction today.

Number two, improve unemployment.In today’s world, the mortgage originations for home purchase seems highly linked to unemployment. When unemployment goes up, the lending goes down and vice versa. The correlation between home buyer mortgage originations and unemployment is -87% since 2006. Previously it was only -39%. Anecdotally I hear more stories today about how difficult it is to get the mortgage applications approved. I see articles and blogs advising readers to discourage job-hopping or making lapses in employment history, etc. in order to improve the chances of getting the mortgage approved. The environment with high unemployment we live today could also make people more nervous. They may not cut into their savings for the down payment of a home purchase, which is required to get the mortgage. Government stimulus or not, in the new world, improving employment should help boost the housing market and the economy.


Who is winning the global competition?

For those of you who love competition, here’s a snapshot of a global competitive landscape. Fortune Magazine publishes the ranking of Global Fortune 500 every year. I took the latest (2012 ranking) and rank ordered top 10 countries that had the largest piece of the pie.

The way Fortune determines its ranking is that they compare annual revenues in U.S. dollars. I counted the number of companies in the ranking by nationality and came up with the chart above. To make things more interesting, I also looked at how these countries stacked up in 1998 and 2007.

It revealed a very interesting picture. Here are some of my observations.

1. Emergence of China: in 1998, there were only 4 Chinese companies. The largest was Bank of China at 174th out of 500. In 2012, there are 73 Chinese companies. That’s the fastest growth any country has seen during these years in the ranking. As a result, who’s got bumped off the top 10 list? Italy. And Canada may be on its way out, either by the emergence of Australia (11th place today) or India / Brazil (both tie at 13th).

2. Fragmentation: In 1998, the top 10 countries had over 90% share of Global Fortune 500. In 2012, their share is reduced to 82.8%. In 1998, there were 23 countries representing 500 companies. Today there are 35 countries. Established nations are being squeezed from emergine ones. In particular, the following countries are growing fast. Russia (1 company in 1998, 4 in 2007, and 7 in 2012), Brazil (5 in 1998, 5 in 2007, and 8 in 2012), and India (1 in 1998, 6 in 2007, and 8 in 2012). No surprises here.

3. Decline of Japan: In 1998, there were 113 Japanese companies listed in Global Fortune 500. There were 67 in 2007 and 68 in 2012. This is a tricky result for 2012. Let’s remember that the Japanese yen increased its value by more than 30% against the U.S. dollar in the last 5 years. So their revenues in U.S. dollars in 2012 may well be inflated. In other words, even if a company has reduced its revenue in yen since 2007, it may have the same or a higher revenue in dollars just because the yen appreciated.

4. The impact of weakening US dollar: The chart shows the U.S. lost 30 “Global Fortune 500” companies from 2007 (162 companies) to 2012 (132). The reason for the loss is partly due to the inflated revenues of non-U.S. companies. Between 2007 and 2012, the US dollar weakened against 7 out of 10 major currencies that represent most of top 10 and emerging countries. It puts the U.S. companies at disadvantage in the comparison like this.

Emerging nations are accelerating growth and taking shares away from established nations. We are facing more diverse and dynamic competition than before. Also we must pay attention to how exchange rates are moving in the world economy. A weak currency can attract foreign tourists, customers and investors. But it also gives a haircut to domestic revenues and profits across the board.


Do you know your company’s strategy?

As I decided to launch this blog, I wanted to make it something meaningful for others. So I did my research and tried to find out what the most frequenly searched phrases regarding business and management were.

“What is leadership?” came as one.

We need leadership because we want to get our stuff done. It doesn’t matter whether your goal is to motivate yourself to get your taxes done or to mobilize 300,000 people to execute a strategy. We need objectives, motivation, and the feedback of whether we are meeting the objectives to move things forward.

With that in mind, wouldn’t you say it would be critically important that we know what it is that we want to accomplish? Unfortunately reality is that we don’t. According to William Schiemann who surveyed organizations for the book called  Performance Management: Putting Research into Action, only 14% of employees know their company’s strategy and direction. That’s surprising.

Let’s reflect ourselves. How often have we communicated what we want? Or have we? What have we anticipated about others’ reactions before we utter our words so we can think about saying it in the right way?

Leadership starts from clear communication. Initiating communication. That’s the most important step in demonstrating effective leadership.