Tuning to National Public Radio the other day, I stumbled across a discussion where a person being interviewed was making remarks about the current state of the U.S. housing market and how important it is to the economy. He said the housing market is where the economic collapse started, so wouldn’t it also be true that it drives recovery? That’s an intriguing question. A house is probably not only the most expensive item to own for many people, it also drives other expenditures like energy, utilities, services, furniture and appliances, etc. Housing activities drive cascading demands which benefit many businesses. So I got curious. What’s keeping the housing market from growing faster?
For those of you who don’t have time to read through the rest, I will give you my observation in a nutshell: It seems that the housing market is not recovering quickly because the banks are not lending enough money to the home buyers. I am not talking about a “course correction” kind of loan reduction. It’s really really low. And forget about the mortgage rates that are record low today. They are not stimulating the growth of our economy as they should. It’s the mortgage volume for purchasing homes that really matters.
For those of you who are interested, I will explain what I found more in detail.
To understand housing market, I decided to pay particular attention to the single-family housing starts. It’s a number that the Census Bureau tracks to measure the number of constructions designed for housing a single-family as opposed to multi-family. I learned that the single-family housing starts is a good indicator for the housing market as it historically mirrors the demand for homes. Also the single-family housing starts is often considered a leading indicator for the economy. If I could build a predictive model where I can point my finger at what really drives the housing starts, then I should have a better sense of which actions are more preferable to drive the economy, right? So that’s what I tried.
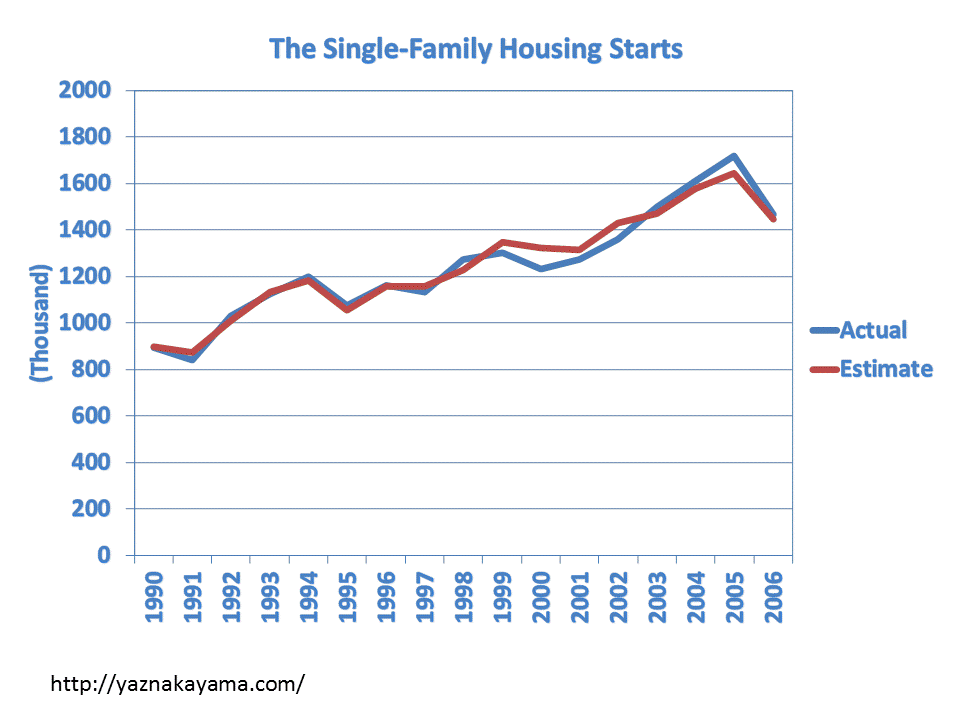
This chart shows both the actual and the estimate of the single-family housing starts based on a simulation model built from a multivariate regression analysis. Multivariate regression is a useful tool to see relationships between various sets of data. For example, you have an idea that people’s weight, the amount of daily exercise and daily sugar consumptions may be all related. Comparing 3 sets of data, the multivariate regression will show us mathematical relationships between them. We can use that math to estimate the weight of a person by plugging in the amount of his daily exercise and daily sugar consumption.
The approach I took to create the housing starts forecasting model was “predicting the past”. Since we already know what happened to the single-family housing starts in our recent history, we can use the knowledge to test the quality of “predictions”. In this case, I took various data from 1990 to 1999 to build a math equation for estimating the single-family housing starts. Then, I used the same equation and plugged in inputs from 2000 and beyond to see if I could accurately forecast the single-family housing starts for the same period. To build this model, I set myself a goal of making predictions within + or -10% of the actual or better for at least 5 years of making predictions. I came to a point where the model became good enough. Between 2000 and 2006, the biggest error happened in the year 2000 when the estimate was off by about 7%.
So what were the drivers? Initially I took a range of data inputs that I suspected would impact the growth of home building activities, like GDP, population, consumer sentiment, interest rates, housing prices, unemployment, etc. With some trial-and-error, I pruned some, added some and made a mix of inputs to give accurate enough estimates. As it turns out, what really mattered to forecast the outcome accurately were long-term interest rates, population, building cost index (inflation adjusted), mortgage originations for home purchase (inflation adjusted), and vacancy rates for homeowner units: 1 unit. There were also inputs I had expected to be important but weren’t. They include unemployment, housing prices, consumer sentiment index and, to some extent, interest rates. (You could actually make almost as accurate forecasts without the long-term interest rates.)
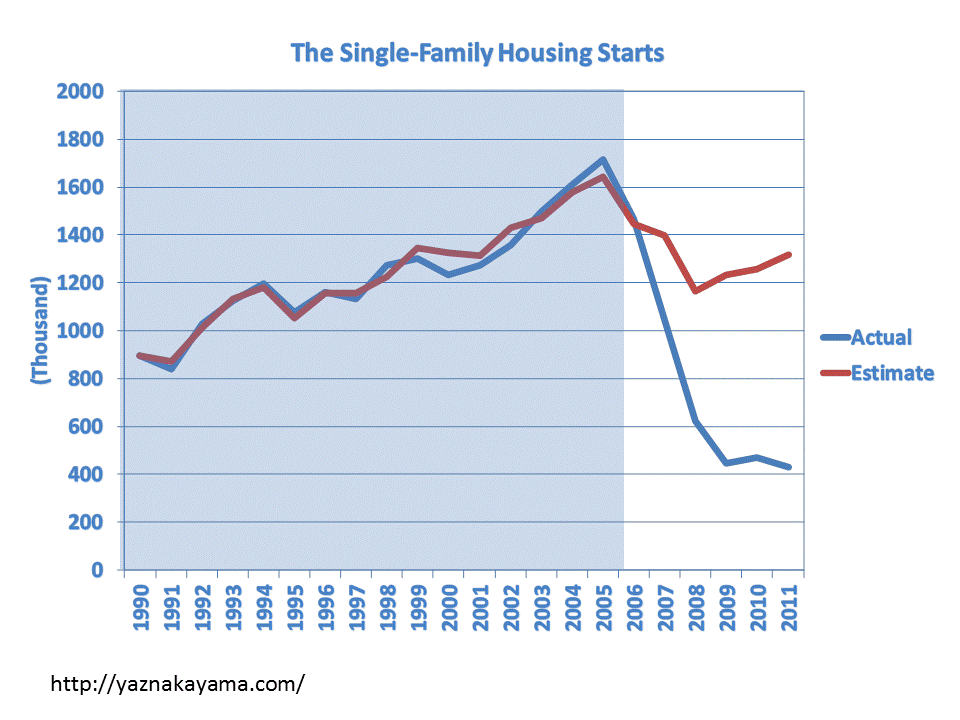
You may be wondering what happened after 2006 as my forecast ended there in the chart above. Well, this is what happened.
Holly crap! The model stopped working. The red line tells me that we should be having more housing constructions if we were still living in the same world that we lived up until 2006. Based on this model, we are not living it today.
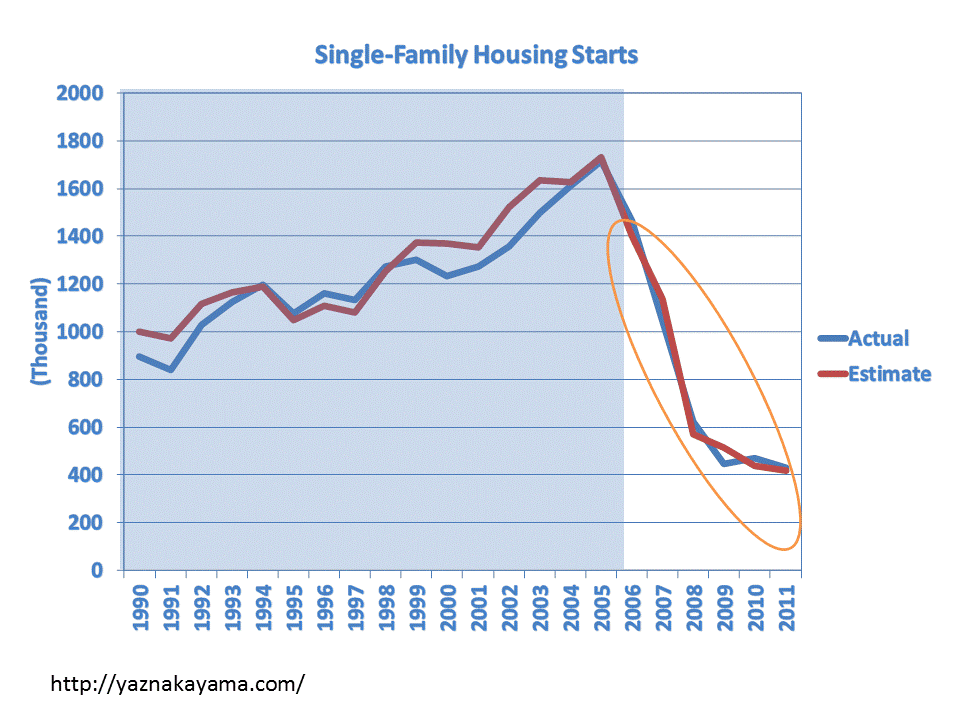
It took me a while to figure this out, but in the new world, I discovered that you don’t need much data input to forecast the housing starts. All I needed was 2 inputs: mortgage originations for home purchase and vacancy rates for homeowner units: 1 unit.
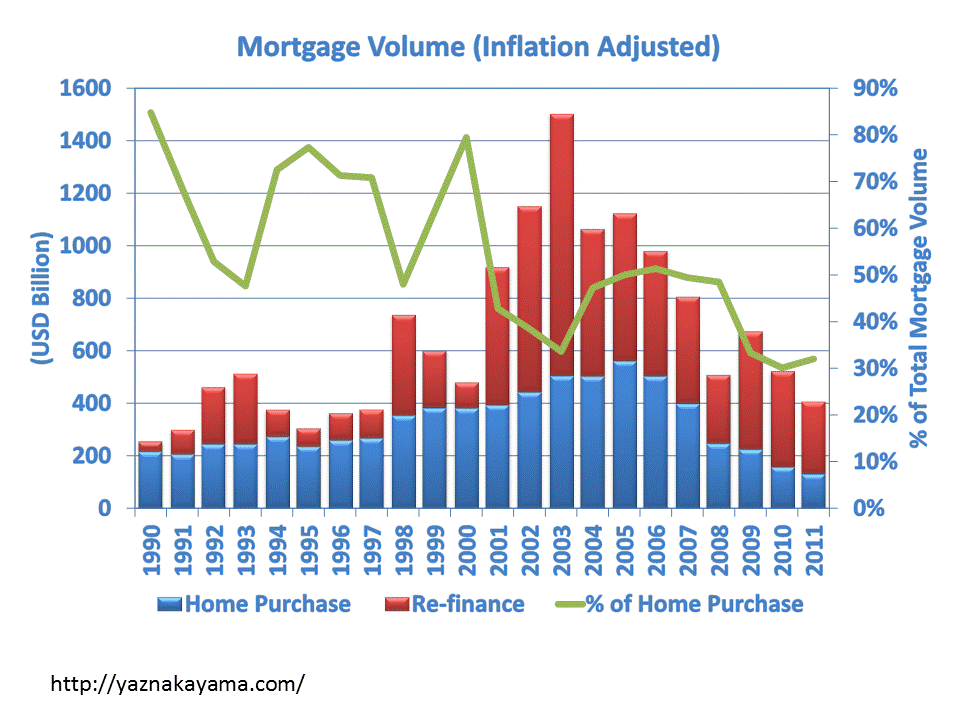
Between the two inputs, the mortgage origination by far has a bigger influence in the housing starts today. The impact of population growth or that of low interest rates are so negligible they no longer link to the changes of the housing starts because the home buyers don’t have enough money to buy houses. Today the volume of mortgage origination to the home buyers is so small. Adjusted for inflation, the mortgage provided to the home buyers in 2011 was only about 60% of what was lent to the home buyers in 1991. If I remember correctly, we saw a housing market crisis in 1991. To make an analogy, it’s like driving a car with the parking brake on. No matter how great your engine or suspension is, it just doesn’t accelerate.
So where is the mortgage money going? It’s going to re-finance existing loans.
So what are actions that will boost the economy going forward? Any actions to stimulate lending for home buyers will definitely help. I have 2 suggestions.
Number one, the banks need to make money. Banks’ current lending practices may be overly cautious. It is true that the Basel III and Tier 1 Capital Ratio requirements are making the banking executives more conservative. However, improved profitability for banks will give added cushion and allows banks to become less constricted in lending more money. I am not advocating for crazy lending and securitization practices that got us into this mess. However, the pendulum seems to have swung a bit too much in the other direction today.
Number two, improve unemployment.In today’s world, the mortgage originations for home purchase seems highly linked to unemployment. When unemployment goes up, the lending goes down and vice versa. The correlation between home buyer mortgage originations and unemployment is -87% since 2006. Previously it was only -39%. Anecdotally I hear more stories today about how difficult it is to get the mortgage applications approved. I see articles and blogs advising readers to discourage job-hopping or making lapses in employment history, etc. in order to improve the chances of getting the mortgage approved. The environment with high unemployment we live today could also make people more nervous. They may not cut into their savings for the down payment of a home purchase, which is required to get the mortgage. Government stimulus or not, in the new world, improving employment should help boost the housing market and the economy.


